Remote Sensing Big Ideas
Remote Sensing is the observation of a phenomenon from a distance. Typically, remote sensing refers to collecting data about the Earth from a satellite or aircraft, but in this case, remote sensing can also be achieved using kites. There are two types of remote sensing: active and passive. Active remote sensing occurs when an instrument emits a signal that is then measured as it is reflected off the Earth, such as radar. In contrast, passive remote sensing involves an instrument collecting a signal that is reflected off the Earth, typically from sunlight. Remote sensing enables us to gather a wealth of information about the Earth, as detailed in the sections below.
Electromagnetic Spectrum
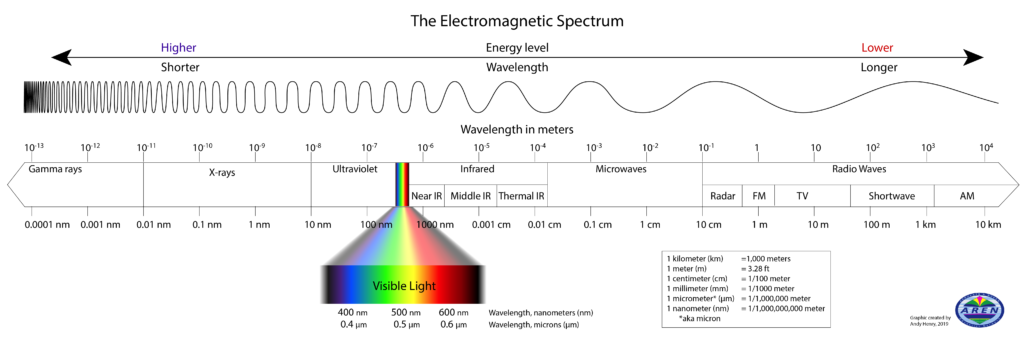
The electromagnetic spectrum encompasses the full range of electromagnetic radiation, including its various wavelengths. All the different forms of radiation are present in the world around us; however, only the visible light region of the spectrum is detectable by the human eye, and the different wavelengths are seen as the colors of the rainbow. Some areas of the spectrum are more commonly known than others. Radio waves are used to transmit songs and shows over the radio, microwaves are used to vibrate the water molecules in food and heat it, and UV, or ultraviolet, waves radiate from the sun. They can cause damage to a person’s skin and eyes, and X-rays are often used in the medical field to see a person’s bones through their skin.
When these forms of electromagnetic radiation interact with matter and transfer energy, it’s called absorption. Different types of matter absorb energy in unique ways and have distinct absorption spectra. One way to measure this is through the energy that is not absorbed, but is instead reflected. The color of objects that we see with our eyes is the energy that is reflected, rather than absorbed. The following image illustrates examples of spectral reflectance, demonstrating the amount of energy reflected by various materials across wavelengths ranging from visible light to mid-infrared.
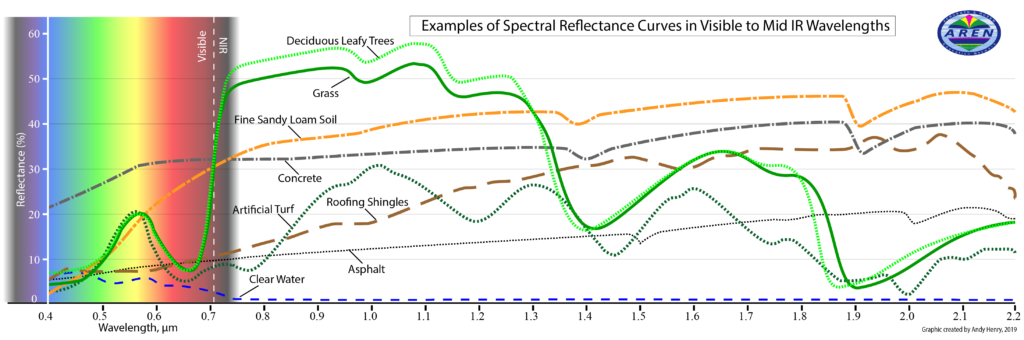
Note the reflectance signature of healthy vegetation (Grass and Deciduous Leafy Trees). It shows that vegetation reflects poorly in blue and red light, but better in the green and yellow regions of the visible range, and reflects much more strongly in the Near-Infrared (NIR) range. This signature is very distinctive and can be used to help monitor vegetation health and productivity.
One way this is applied is in the study of plants. During photosynthesis, plants absorb and reflect colors in different quantities. Red and blue are mainly absorbed and used in food production, whereas green is only partially absorbed, and almost no near-IR light is absorbed. The higher reflectance of green compared to blue and red is why plants appear green to the human eye. Similarly, because near-IR is almost entirely reflected by vegetation, plants appear bright white when viewed through an infrared filter. This phenomenon enables the observation and study of plants using near-infrared (NIR) cameras, such as those on the TwinCam Aeropod.
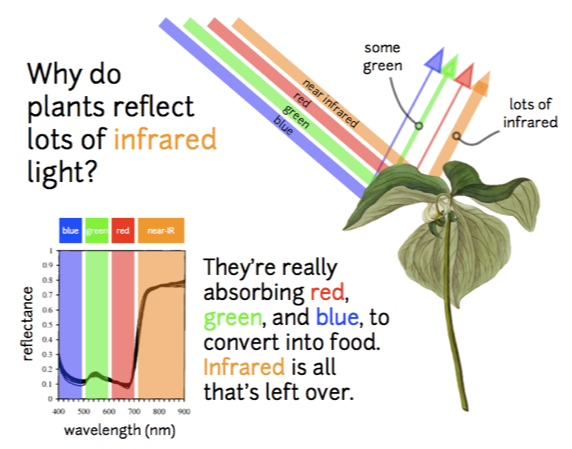
Image Processing - Creating Information from Image Data
Aerial Image Interpretation (Photogrammetry)
Using aerial images to understand features on the ground goes back to the earliest usage of kites and balloons to carry cameras. Today aircraft and satellites collect imagery that is use to monitor everything from urban sprawl to troop to military installations and troop movements. Modern AI is increasingly being used to analyze images, but human interpretation is still needed for many applications. Learning how to interpret aerial and satellite images is both an art and a science.
Manual Image Classification
Image classification is the differentiation of an area of earths surface into different types of land cover, such as grass, road, trees, etc. Image classification is used to quantify the types of features in an image and create statistics that can be used for a variety of purposes.
A standard set of visual tools can be used to help understand what is being viewed in aerial images. This set is called the Elements of Image Interpretation. Like the scientific method, it has different flavors, but usually involves trying to identify the features in an image by utilizing the following clues:
- Size
- Shape
- Tone and color
- Pattern
- Texture
- Shadow
- Association (What is it with that may give a clue – i.e., tennis courts, ball fields and big parking lots may help indicate that a building is a school)
- Site and Situation (General information about the location that may help determine what the feature is.)
Computer Aided Image Classification
Traditionally, classification images were created manually using a pixel-based technique. Scientists would visually identify areas of different colors, textures, patterns, and shading to differentiate between land cover types, but this process could be tedious and time-consuming. Today, software tools exist for conducting pixel-based image classification, which are categorized into two types: supervised and unsupervised classification. Supervised classification enables the user to guide the classification by selecting training fields or areas that accurately represent a specific land cover type. The software then uses those training fields to identify similar pixels, calculates the probability that each pixel belongs to one of the predefined land cover types, and classifies it accordingly. In the unsupervised software, the user does not assign training fields but has the option to designate a number of different land cover types. Otherwise, the algorithm determines, through statistical analysis, how many types exist and which areas of the image belong to each type.
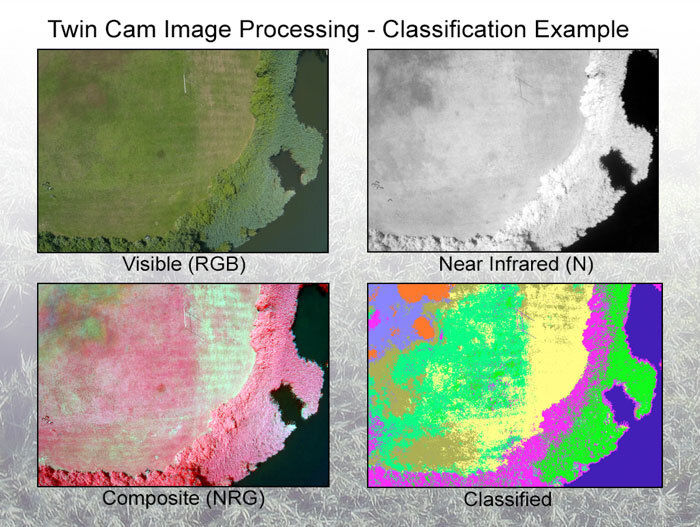
In the AREOKATS program, we can perform image classification using images captured by the TwinCam, which features a color camera mounted side by side with a near-infrared camera. The cameras are arranged together to capture nearly simultaneous images of the same study area. With an RGB (red, green, blue) color image and a near-infrared image, we can learn a great deal about vegetation due to the unique way light interacts with plants. By replacing either the red or blue band in the RGB image with the near-IR image, we create a composite image. That image can be further processed in image software, like MultiSpec, to create classified images that detail different vegetation types. The following image shows an example of a classified image, where the different plant types are differentiated from each other as well as from the water and dirt patches seen in the RGB image. Classification images provide valuable information about vegetation with applications in the field of agriculture, invasive species monitoring, and mitigation.
Structure From Motion
Structure from motion is a technique to combine a series of 2D images into a 3D image. A collection of pictures must be taken with substantial overlap across the photos, as well as reasonable resolution. Similar to the way we move around to comprehend the distance and shape of an object with our eyes, it is also necessary to take pictures from multiple angles for structure from motion (SfM) software to learn about 3D objects. SfM software first identifies areas of commonality between pictures using a feature detector and then creates a dense point cloud that can be masked over to make a 3-dimensional image.