Overview
Scientists, natural resources managers, urban planners, and many others use aerial and satellite imagery to map and understand the Earth’s surface and how it is changing. Using a combination of aerial and satellite imagery enables both a “big picture” look at landcover and land use, as well as the ability to get in closer for more detail. Imagery taken over time helps scientists understand how the environment is being impacted by human and natural causes. Scientists use software to process this imagery into a range of landcover categories or ‘classes’. This enables them to quantify the surface features and monitor them for change. In this exercise, students learn how a simple aerial image can be classified and quantified using just a printer, calculator, graph paper, and crayons or colored markers.
NGSS Science Standards
- MS-ESS3-3
- MS-ESS3-4
- HS-ESS3-3
- HS-ESS3-6
Technology required
Aerial or satellite image, graph paper, color printer, crayons or colored pencils/markers, spreadsheet program (optional)
Setting
- Classroom
Resources Included for this Learning Activity
- Handout
- Video
- Photo
- Link
Resources for this Project
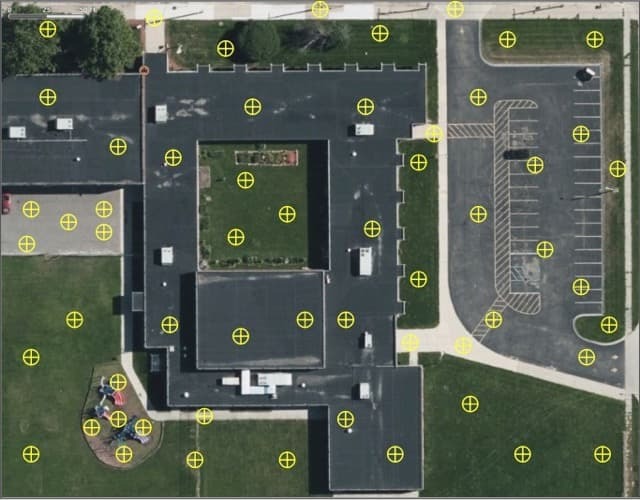
The images below in the gallery are referenced in this PDF.
Create Gridded Image to Print
- Image Classification Grids (Google Slides)
Lesson Duration
- 1-2 class periods
Participant Group Size
- N/A
Analysis Type
- Descriptive, Qualitative
History of development and implementation of this learning activity:
- (N/A)
AREN Learning Activity photo gallery - Manual Classification of Aerial Imagery