Overview
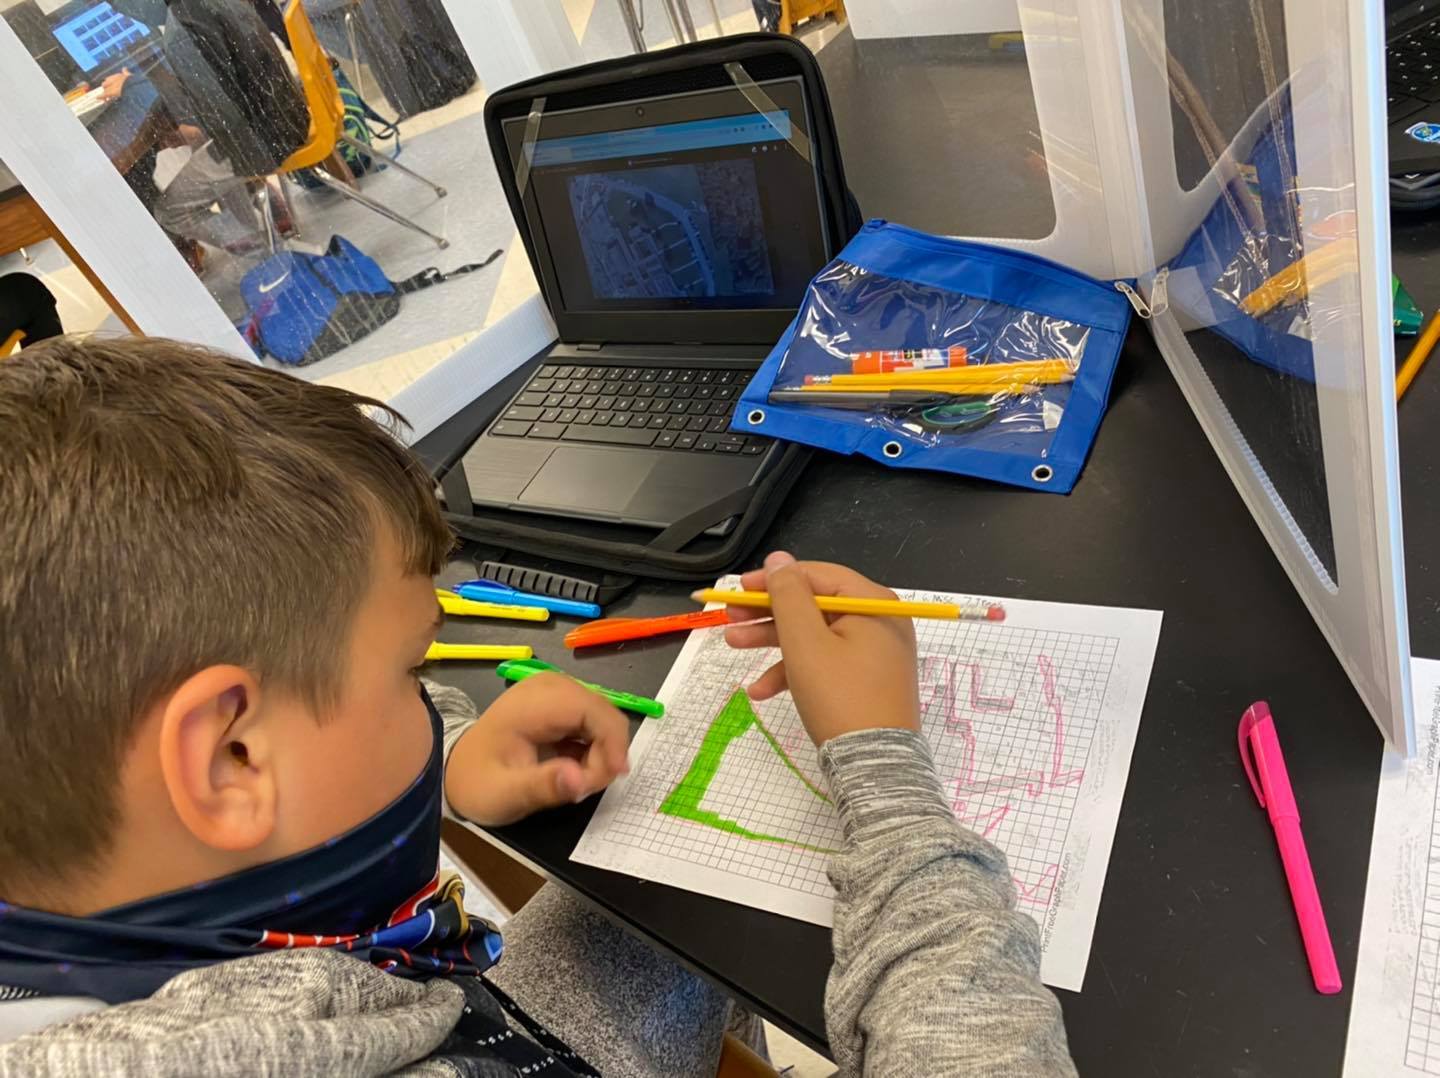
This exercise can be used as an extension of the manual Image Classification activity or used as a standalone. In this exercise, we will use a handheld InfraRed Thermometer (IRT) to gather surface temperature information about a local environment, and then use an aerial image and graph paper to create a map of surface temperatures. We will also create graphs of the data and produce an approximation of a 30 meter resolution satellite view of the same area.
Activity Resources
NGSS Science Standards
- MS-ESS3-3
- MS-ESS3-4
- HS-ESS3-3
- HS-ESS3-6
Setting
- Outdoor
- Classroom
Resources Included for this Learning Activity
- Instructions
- Photos
Lesson Duration
- 2-3 class periods
Participant Group Size
- N/A
Technology required
- Aerial image of study site
- Handheld InfraRed Thermometer (IRT)
- Calculator
- Graph paper
- Color printer
- Crayons or colored pencils/markers
- Spreadsheet program (optional)
Analysis Type
- descriptive
- quantitative
History of development and implementation of this learning activity
- N/A